What to display for histogram
This allows to adjust what items should be shown when
displaying a histogram like title, statistics box etc.

How to display a 1-dim histogram
Here error bars, filling and contours may be choosen.
Fitting of Gaussian optionally with linear background
when dragging with mouse button 1 pressed can be
switched on and off here.
Width + threshold in fpeak
HistPresent implements a simple peakfinder.
Here the two relevant parameters may be set.

Display mode of 2-dim histogram
ROOT has many different ways to plot a 2-dim histogram
like boxes all sorts of lego plots etc.

Color mode of 2-dim histogram
If the color option is used different color palettes
may be choosen:
 - Grey scales with highest value black of white
 - Rainbow colors
 - User selected color transitions in RGB (red - green - blue)
   or HLS (hue, lightness, saturation)
   These values may be adjusted in real time by sliders

Contour levels and colors may still be modified from
the Set User Contour popup.
 LogScale_Minimum
    This allows to set the minimum when logarithmic sales
    are used with 2-dim histograms
 LinScale_Minimum
    This allows to set the minimum when linear sales
    are used with 2-dim histograms

Various HistPresent options
These options are described in some detail below.
Also this widget provides its own Help button.

Help_on_ShowFitted
Help_on_RemParTrees
Help_on_RememberLastSettings
Help_on_RememberZoomings
Help_on_AttrMacro
Help_on_RegExp
Help_on_Auto_1dim
Help_on_Auto_2dim

 Max Entries in Histlists
    When very many histograms are in one file this
    parameter avoids crashing some X-implementations,
    default value 333
 AutoUpdateDelay
    This is the update frequency when using the
    automatic update option.

Default window sizes and positions
Default sizes of windows for 1-dim and 2-dim histograms
may be adjusted seperately. Units are in pixels.
Each new window is shifted according to the values of
Window_Shift_X and Y starting at Window_Top_X and Y.

The window size of histogram lists can be adjusted
by the value of Window_X_Width_List as follows:

> 0 : take value as it is in units of pixels
= 0 : take default value (250)
-1  : calculate width to fit longest item without
      using a scrollbar

The parameter Project_Both_Ratio determines the
space left for the original scatter plot when the
the Display action ProjectBoth is used.

Graphics Attr (Canvas, Pad..)
This menu gives access to most parameters in the ROOT class
TStyle.
E.g. From here one can set the Pad right margin to give more
space if a color palette with long numbers are drawn in
2-dim hist with colz option.
To control the numbers of digits used in labels (i.e. before
powers of ten are used) select the X axis attributes
and then Max digits used in labels
N.b.: X, Y, Z axis attributes my be changed seperately or
      all at time from the X axis attributes widget
      when pressing Set Y, Z axis to same value.
Caveat: By setting color values to "0" you may make parts
        or all the picture invisible.


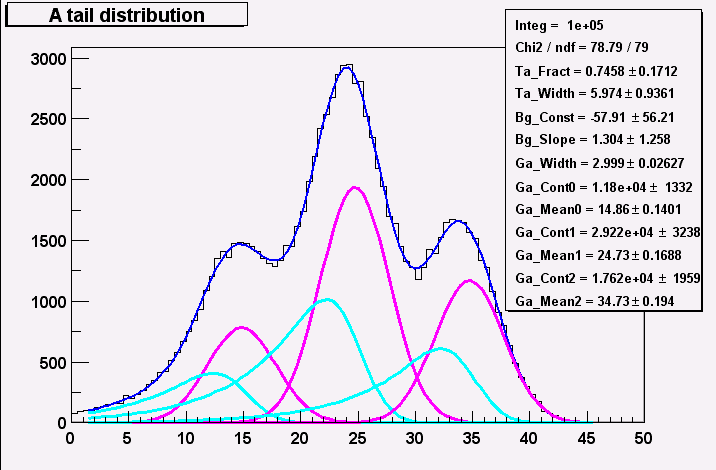
Display fitted curves
This option controls which curves are drawn if a function
is fitted to a 1_dim histogram. (see Help_on_Fit_1dim_Menu)
This function is normally is a sum of several components
(Gauss, linear background). As default only the sum of
the components are drawn. If this option is active all
components are shown allowing a better visual control of
the fit. An example is given


Remember hist limits when showing trees
When displaying trees (ntuples) limits for histograms
(number of channels, lower, upper edge), these values
may be remembered for each tree entry between sessions.


Help_on_RememberLastSettings
Remember expand settings (set via marks), calibrations etc.
This option allows to remember for the same and future sessions:
expand limits, log scales, axis titles,
calibrations i.e. the values of the lower and upper edge of a
1-dimensional histogram.
Zoomings done by dragging the left mouse in the scale are
not remembered by this option. To do achieve this the option
RememberZoomings must be activated.


Help_on_RememberZoomings
Pressing the left mouse button in the scale of a histogram
dragging to the required limit allows to zoom in the picture.
Note: The cursor symbol must a hand with forefinger.
This option allows to pass these limits to later sessions.


Invoking attributes macro
Each time a histogram is displayed a macro (FH_setdefaults.C)
may be executed. This macro may be edited from the HistPresent
start menu: EditAttrMacro
This option can be switched on or off.


Use Regular expression syntax
Normally wild card syntax (e.g. ls *.root to list all
files ending with .root) is used in file/histo selection
masks. One may switch to the more powerful Regular expression.
For details consult a book on Unix.


Auto exec macro 1-dim
A macro (default name auto_exec_1.C) is executed when the left
mouse button is pressed in a pad containing a 1-dim histogram.
The default behaviour is as follows:
   In a pad with several hists: display this hist enlarged
   On a histogram contour:      print info for this channel
   In the statistics box:       print full statistics
   On a function:               print its parameters.


Auto exec macro 2-dim
A macro (default name auto_exec_2.C) is executed when the left
mouse button is pressed in a pad containing a 2-dim histogram.
The default behaviour is as follows:
   In a pad with several hists: display this hist enlarged

   When the mouse is moved:
   Open a new window and display a histogram containing the
   projection on the x-axis taking only the channels with the
   y-values pointed to by the mouse.
   This feature can be switched by the options:

Auto exec project X
and
Auto exec project Y
